ChartSmithGPT
Paste a table. Get a chart. Zero design skills required.
About This Project
What started as a custom GPT is now a live micro app built directly into this portfolio. Substack has zero native support for data visualizations — no charts, no graphs, nothing — so I built ChartSmithGPT to fill the gap. Paste in any table (CSV, Excel, raw Markdown), pick a chart type and color palette, and export as PNG for easy embedding in Substack posts.
The AI handles format detection, suggests the best visualization for your data, and generates styled charts you can download as PNG or SVG. Built to scratch my own itch: I write a lot of posts with rankings, scores, and data breakdowns, and I got tired of screenshotting ugly spreadsheets.
More Like This
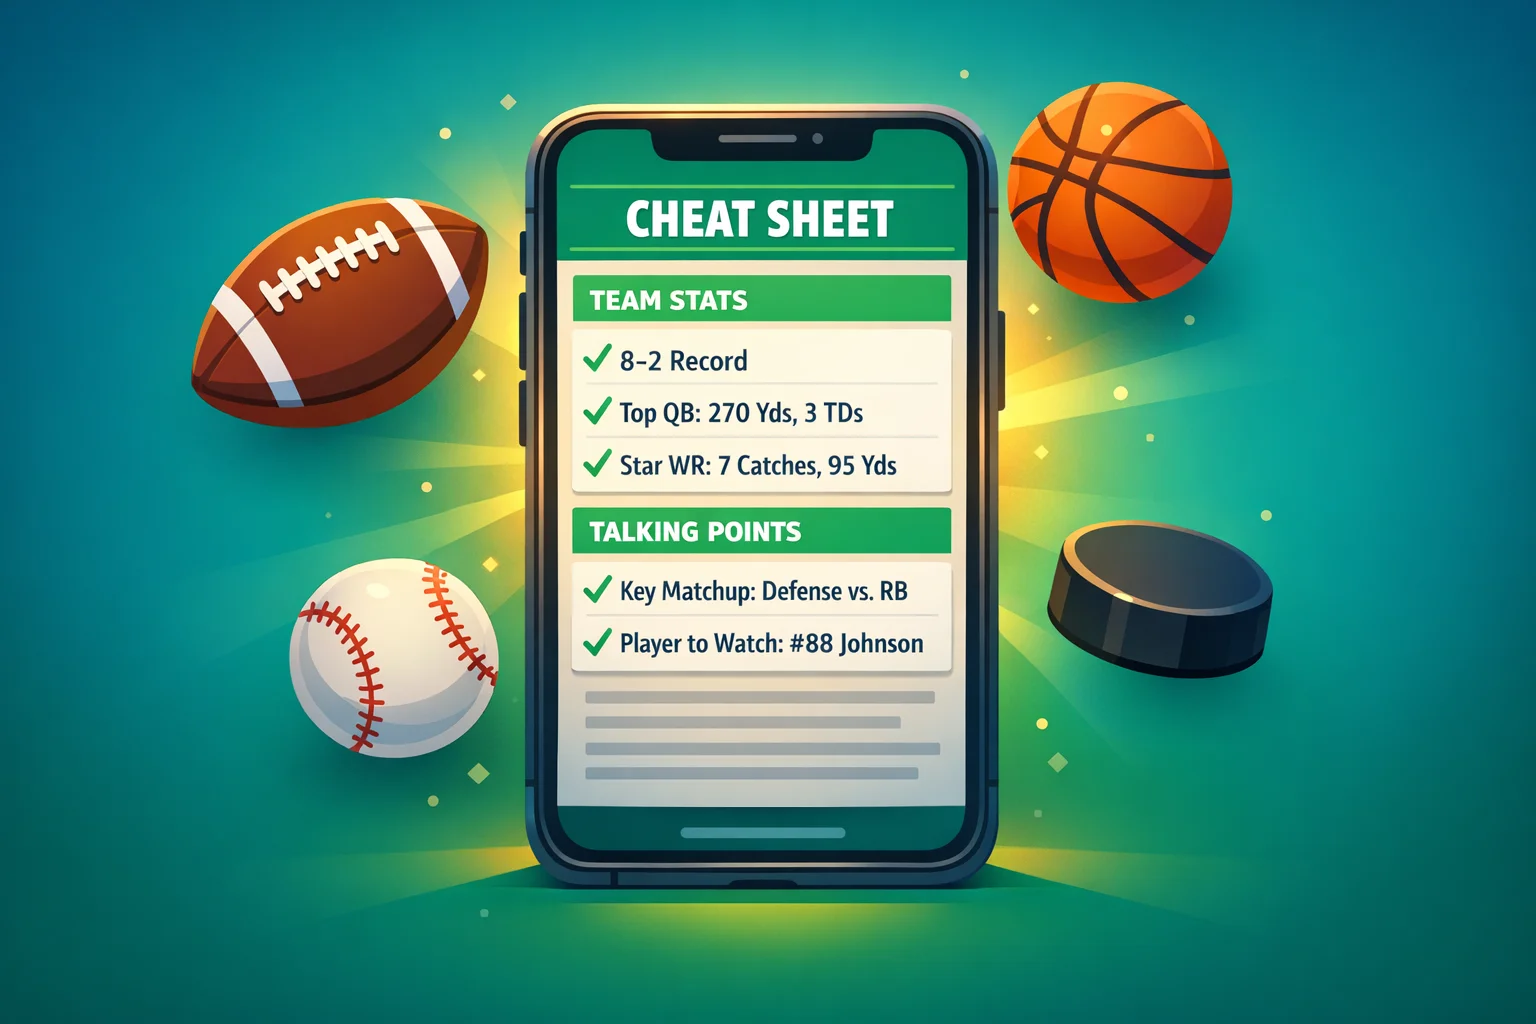
BandWagon Buddy
CustomGPT that generates 650-800 word sports cheat sheets using o3 + real-time Sports-Reference/ESPN data.
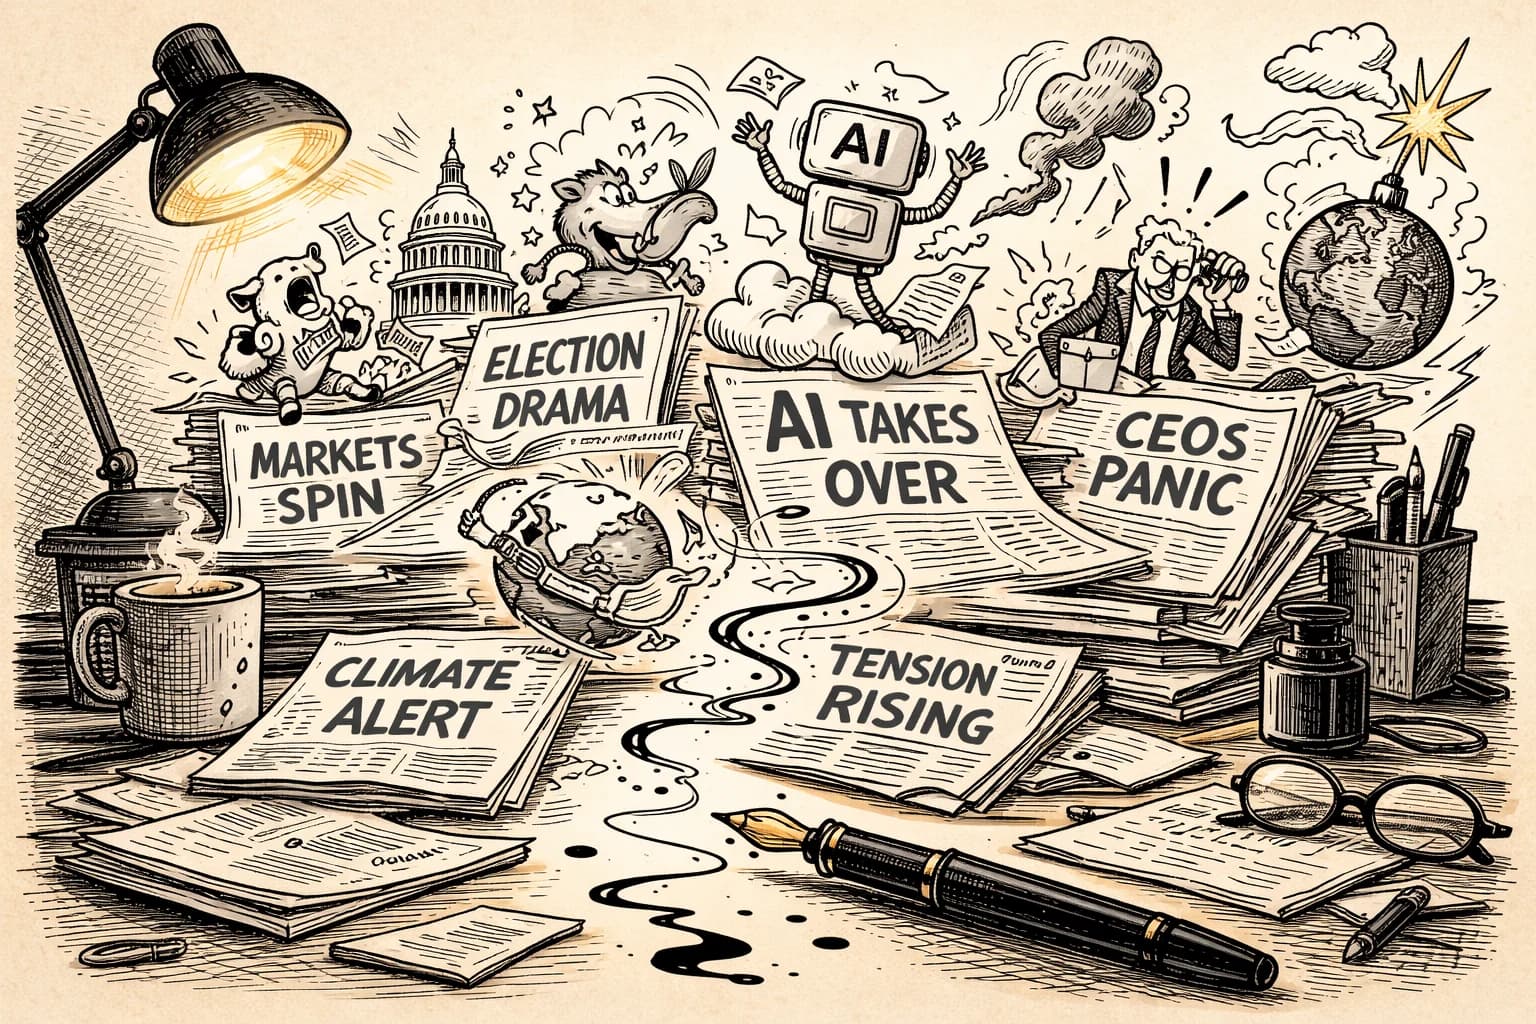
Irony Illustrated
News headlines → dry New Yorker-style cartoon prompts → GPT Image 1 / Grok / Meta AI.

SwiftieGPT
Notes from inside the Swiftie Industrial Complex — an AI app that explores the gap between Taylor Swift fandom, parasocial relationships, and what we project onto pop stars. Part satire, part genuine product.